US equity markets might be closed for Good Friday, but the FX market is still open, and I am still watching the Yen.« Continue »
USD/JPY Trading Ideas April 14


US equity markets might be closed for Good Friday, but the FX market is still open, and I am still watching the Yen.« Continue »

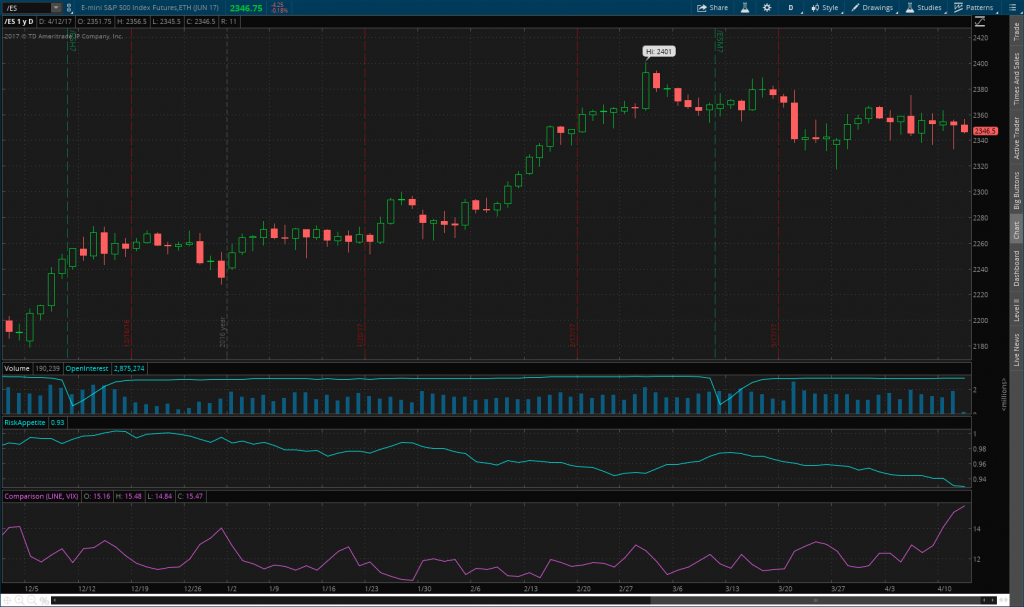
Below is a chart of $ES, along with the extended risk appetite index (eRAI) and VIX between December 1st, 2016 through the current values today. Risk appetite dropped considerably yesterday, while the VIX rose by a fair margin. The eRAI has been on a more or less downward trend since the middle of March.

I am long VIXY and RWM, and generally hold bearish positions such as SH, DOG, etc.

The S&P 500 has been staying above the 2350 support level for a while, This has pushed the index outside of its downward trading channel. Meanwhile, volatility has increased at a reasonable pace.« Continue »

I have written a few articles about marijuana stocks. This article is an update on marijuana related legislation and past stock selections, as well as a quick discussion on one new selection for my watch list.« Continue »
The goal of this discussion is to explain the basics of Elliott Wave Theory and how it is compatible with a market which is driven, as a whole, by fundamentals and news. For this article, I am going to assume that the basics of Elliott Wave Theory are understood. It will therefore be very brief.« Continue »

While I do not use Fibonacci retracement and extensions very much, drawing a retracement study from the most recent high to the most recent low, it is clear that the index has spent a lot of time around a few price levels: 11.79, 12.34, and 13.24. If the VIX breaks above this level, we could see a movement to the 161.6% level which would place the VIX at 14.70. This would place the VIX above its 50, 100, and 200 day moving averages.
