I find it interesting how foreign things like stocks and investing are to so many people. So I decided to write Investing 101 as a primer for anyone interested in learning a bit more. I will add more to this primer over time, as readers ask specific questions that they want answered.« Continue »
Watching S&P 500 Financials
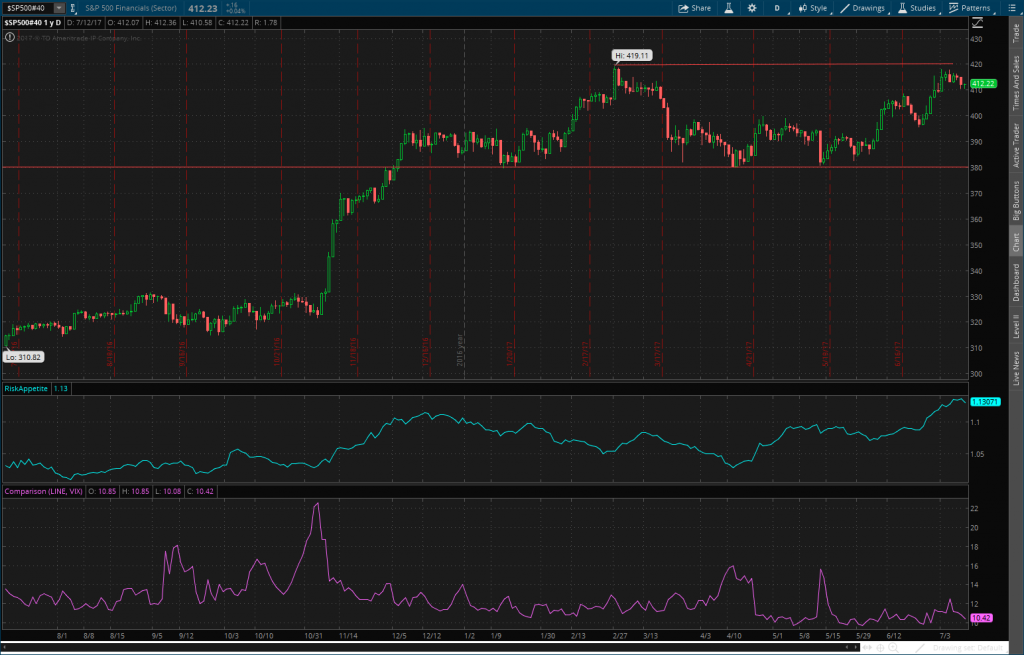
I am still concerned about the financial sector in the long run. As I mentioned in “Breaking Down Bank Earnings,” a lot of the movement in the S&P 500 has come from the financial sector (XLF), and profits for the financial sector have been coming from this inflated bull market. This, along with the interconnectedness that (XLF) has with the broader market, largely through (SPY) constitutes a lot of systemic risk.
However, while there is a lot of risk, especially in the long run, the financial sector is bordering on another move higher. It depends on whether or not it can break through a key resistance level. If it does move higher, it could take the rest of the market with it.
As you can see, the $SP500#40 has been moving sideways, within a channel between roughly 380 and 420 for quite some time now. I am waiting to see if there is a significant break above 420.
Markets Leveling Off
After the round one loss by Marine Le Pen, investors moved back to a risk-on psychology. The Yen and gold dropped considerably, even against the declining dollar. NASDAQ reached a new high of 6,000. The Russell 2000 also reached a new high, breaking out of its long term sideways trading channel. The S&P 500 also closed on in its all time high.« Continue »
Launchpad: Week Of 4/23/2017
I did not have a chance to finish my wrap-up last week, as I was waiting on another pending article to go live. So instead I am making sure to get a launchpad completed. Also, I have decided to move the wrap-up and launchpad posts to my page rather than have them as exclusive articles on Seeking Alpha, as this will allow me to get the articles out to readers more quickly. As this is a launchpad, I will go over a lot of what happened last week, but will try to focus heavily on the week ahead.
S&P 500
Through last week, the S&P 500 (SPY) has been hovering around the 2350 support/resistance level. It has also been staying more or less below its 50 day moving average. Indeed, it barely went above the moving average all week. During Friday’s trading session, it appeared as if the S&P 500 would maintain its move above 2350, which it broke the day before. However, in mid day trading, there was a quick drop below 2350 and the index closed at 2348.69. This marks the second week in a row in which the S&P 500 closed below the 2350 level. Furthermore, six of the last seven trading days had closing values below that level and all seven days closed below the 50 day moving average. While not perfect, there is also what appears to be a harami candlestick pattern. Harami patterns are often indicative of a turnaround, but the French election results have had a significantly positive impact on sentiment here in the states.
The shift in sentiment should push the S&P 500 higher, but there are still multiple resistance levels that the index would have to overcome in order to see new highs. I still do not see any change in fundamentals or data which would shift sentiment high enough to overcome such resistance. Right now we are just roughly back to where we were the last time we were approaching the 2,400 level.
Volatility
VIX and (VIXY) both started to cool last week, but perceived volatility has been showing more persistence than after past spikes. While both the VIX and VIXY are now down considerably after the first round of the elections, it took quite a while, and we are not seeing new lows. I would not be surprised to see a turnaround later this week as we approach a potential government shutdown. Indeed, while VIX hit a low of 11.14 in pre-market trading, it did not even hit the low of 10.88 and as of 9:18AM was over 11.44 price level. I have been utilizing a Fibonacci retracement analysis between 10.88 and 13.24 for a while and it seems to be providing useful information.
Risk Appetite
The same factors which have brought down perceived volatility have also impacted gold (GLD) and the Yen (FXY). We are certainly in a risk-on state. However, just as I am not confident that perceived volatility will stay low, I am not convinced that we are going to stay in a risk-on mode, even though the current impact, from decline in both of gold and the yen, on my risk appetite index has been substantial.
News and Week Ahead
Last week, we saw an uptick in weekly jobless claims and the Philly Fed factory guage sliding from 32.8 down to 22.0. Markit manufacturing and services indices were also down slightly. Industrial production, capacity utilization, and existing home sales were up. This coming week, there will be a number of data points to watch. First, earnings reports are continuing to roll in. On the macro level, we are going to get our first look at Q1 GDP growth. If it is anywhere near as bad as the Atlanta Fed GDP Now prediction is suggesting, that will be quite painful. It would put us very close to 0% GDP growth for the quarter, and any further negative growth would likely throw us into a recession.
As I mentioned earlier, we are also coming up against a hard deadline for a government shut down. In the past, we have seen a lot of pomp and circumstance around government shutdowns, but this time whether or not we get an actual shutdown may be tied to a vote on the border wall between the United States and Mexico. Either option is not very pleasant. A border wall is simply a waste of taxpayer money while a government shutdown will have short term negative consequences as people will have trouble getting paychecks, pensions, and so on.
VIX Analysis 4/18/2017
VIXY topped out on Friday, in after hours trading. However, VIX and VIXY have not seen the large drop which we are accustomed to seeing after a bump. Certainly they have fallen, but they are still seeing a lot of support.« Continue »
USD/JPY Trading Ideas April 14
US equity markets might be closed for Good Friday, but the FX market is still open, and I am still watching the Yen.« Continue »
Potential VIX Pop
While I do not use Fibonacci retracement and extensions very much, drawing a retracement study from the most recent high to the most recent low, it is clear that the index has spent a lot of time around a few price levels: 11.79, 12.34, and 13.24. If the VIX breaks above this level, we could see a movement to the 161.6% level which would place the VIX at 14.70. This would place the VIX above its 50, 100, and 200 day moving averages.